pprof
Go语言内置了获取程序的运行数据的工具,包括以下两个标准库:
runtime/pprof:采集工具型应用运行数据进行分析net/http/pprof:采集服务型应用运行时数据进行分析
net/http/pprof源码上也是根据runtime/pprof进行编写
pprof开启后,每隔一段时间(10ms)就会收集下当前的堆栈信息,获取各个函数占用的CPU以及内存资源;最后通过对这些采样数据进行分析,形成一个性能分析报告。
注意,我们只应该在性能测试的时候才在代码中引入pprof
作用
pprof 是 Go 语言中分析程序运行性能的工具,它能提供各种性能数据:
| 类型 | 描述 |
|---|
| allocs | 内存分配情况的采样信息 |
| blocks | 阻塞操作情况的采样信息 |
| threadcreate | 系统线程创建情况的采样信息 |
| goroutine | 当前所有协程的堆栈信息 |
| heap | 堆上内存使用情况的采用信息 |
| mutex | 锁争用情况的采样信息 |
| cmdline | 显示程序启动命令以及参数 |
| profile | CPU占用情况采样信息 |
| trace | 程序运行跟踪信息 |
工具型
runtime/pprof包中预制了一些profile:
- cpu:cpu使用情况
- memory(heap):内存使用情况
- threadcreate: os线程使用情况
- goroutine:所有当前运行的goroutine堆栈跟踪信息
- block:goroutine阻塞等待的情况
- mutex:锁竞争的情况(一般是由于锁竞争导致cpu未被充分利用)
开启CPU性能分析:
1
| pprof.StartCPUProfile(w io.Writer)
|
停止CPU性能分析:
应用执行结束后,就会生成一个文件,保存了我们的 CPU profiling 数据。得到采样数据之后,使用go tool pprof工具进行CPU性能分析。
记录程序的堆栈信息
1
| pprof.WriteHeapProfile(w io.Writer)
|
得到采样数据之后,使用go tool pprof工具进行内存性能分析。
go tool pprof默认是使用-inuse_space进行统计,还可以使用-inuse-objects查看分配对象的数量。
案例
 1
 2
 3
 4
 5
 6
 7
 8
 9
10
11
12
13
14
15
16
17
18
19
20
21
22
23
24
25
26
27
28
29
30
31
32
33
34
35
36
37
38
39
40
41
42
43
44
45
46
47
48
49
50
51
52
53
54
55
56
57
58
59
60
61
62
63
64
65
66
67
68
| package main
import (
"flag"
"fmt"
"os"
"runtime/pprof"
"time"
)
// 一段有问题的代码
func logicCode() {
var c chan int
for {
select {
case v := <-c:
fmt.Printf("recv from chan, value:%v\n", v)
default:
}
}
}
func main() {
// 两个标志位: 是否开启CPU和内存的标志位
var isCPUPprof bool
var isMemPprof bool
// 命令行参数定义
flag.BoolVar(&isCPUPprof, "cpu", false, "turn cpu pprof on")
flag.BoolVar(&isMemPprof, "mem", false, "turn mem pprof on")
flag.Parse()
// 是否开启CPUprofile
if isCPUPprof {
// 在当前路径建立一个文件
file, err := os.Create("./cpu.pprof")
if err != nil {
fmt.Printf("create cpu pprof failed, err:%v\n", err)
return
}
// 往文件中记录CPU proofile信息
pprof.StartCPUProfile(file)
defer func() {
pprof.StopCPUProfile()
file.Close()
}()
}
for i := 0; i < 8; i++ {
go logicCode()
}
// 程序跑20s
time.Sleep(20 * time.Second)
// 是否开启内存profile
if isMemPprof {
file, err := os.Create("./mem.pprof")
if err != nil {
fmt.Printf("create mem pprof failed, err:%v\n", err)
return
}
pprof.WriteHeapProfile(file)
file.Close()
}
}
|
等待20s,生成cpu.pprof
1
2
3
4
5
6
| go tool pprof cpu.pprof
Type: cpu
Time: Jan 7, 2023 at 12:51am (CST)
Duration: 20.30s, Total samples = 100.47s (494.88%)
Entering interactive mode (type "help" for commands, "o" for options)
(pprof)
|
- Duration:程序执行时间。
- Total samples:采样时间,比如采样时间100s,有10核,每核采样10s
输入top 5来显示占用CPU前5的函数:
 1
 2
 3
 4
 5
 6
 7
 8
 9
10
| (pprof) top 5
Showing nodes accounting for 98.19s, 97.73% of 100.47s total
Dropped 44 nodes (cum <= 0.50s)
Showing top 5 nodes out of 9
flat flat% sum% cum cum%
49.38s 49.15% 49.15% 49.54s 49.31% runtime.chanrecv
33.20s 33.04% 82.19% 83.07s 82.68% runtime.selectnbrecv
14.76s 14.69% 96.88% 98.16s 97.70% main.logicCode
0.46s 0.46% 97.34% 0.76s 0.76% runtime.findrunnable
0.39s 0.39% 97.73% 2.19s 2.18% runtime.schedule
|
- flat:当前函数占用CPU的耗时
- flat%::当前函数占用CPU的耗时百分比
- sun%:函数占用CPU的耗时累计百分比
- cum:当前函数加上调用当前函数的函数占用CPU的总耗时
- cum%:当前函数加上调用当前函数的函数占用CPU的总耗时百分比
- 最后一列:函数名称
可以看出,main.logicCode占用的cpu最多
输入list logicCode来查看具体的信息:
 1
 2
 3
 4
 5
 6
 7
 8
 9
10
11
12
13
14
15
16
17
18
19
20
| (pprof) list logicCode
Total: 100.47s
ROUTINE ======================== main.logicCode in D:\go\project\test_project\ip-get\pprof_test\main.go
14.76s 98.16s (flat, cum) 97.70% of Total
. . 7: "runtime/pprof"
. . 8: "time"
. . 9:)
. . 10:
. . 11:// 一段有问题的代码
. 120ms 12:func logicCode() {
. . 13: var c chan int
. . 14: for {
. . 15: select {
14.76s 98.04s 16: case v := <-c:
. . 17: fmt.Printf("recv from chan, value:%v\n", v)
. . 18: default:
. . 19:
. . 20: }
. . 21: }
(pprof)
|
很明显得出:case v := <-c:这行代码有问题,当然代码的问题也很明显,因为default无内容,channel中又没有任何信息,会一直卡在这处代码,所以解决方案,default加一些信息即可
 1
 2
 3
 4
 5
 6
 7
 8
 9
10
11
| func logicCode() {
var c chan int
for {
select {
case v := <-c:
fmt.Printf("recv from chan, value:%v\n", v)
default:
time.Sleep(time.Second * 2)
}
}
}
|
重新生成,发现问题消失
1.3.3 命令说明
- web:浏览器会弹出各个函数之间的调用图,以及内存的之间的关系
- top:按指标大小列出前n个函数,比如内存是按内存占用多少,CPU是按执行时间多少。
- list:查看某个函数的代码,以及该函数每行代码的指标信息,如果函数名不明确,会进行模糊匹配,比如
list main会列出main.main和runtime.main - traces:打印所有调用栈,以及调用栈的指标信息。使用方式为
traces+函数名(模糊匹配)。
1.3.4 图形化
地址:https://graphviz.gitlab.io/
安装完后,在pprof命令中输入svg或者gif
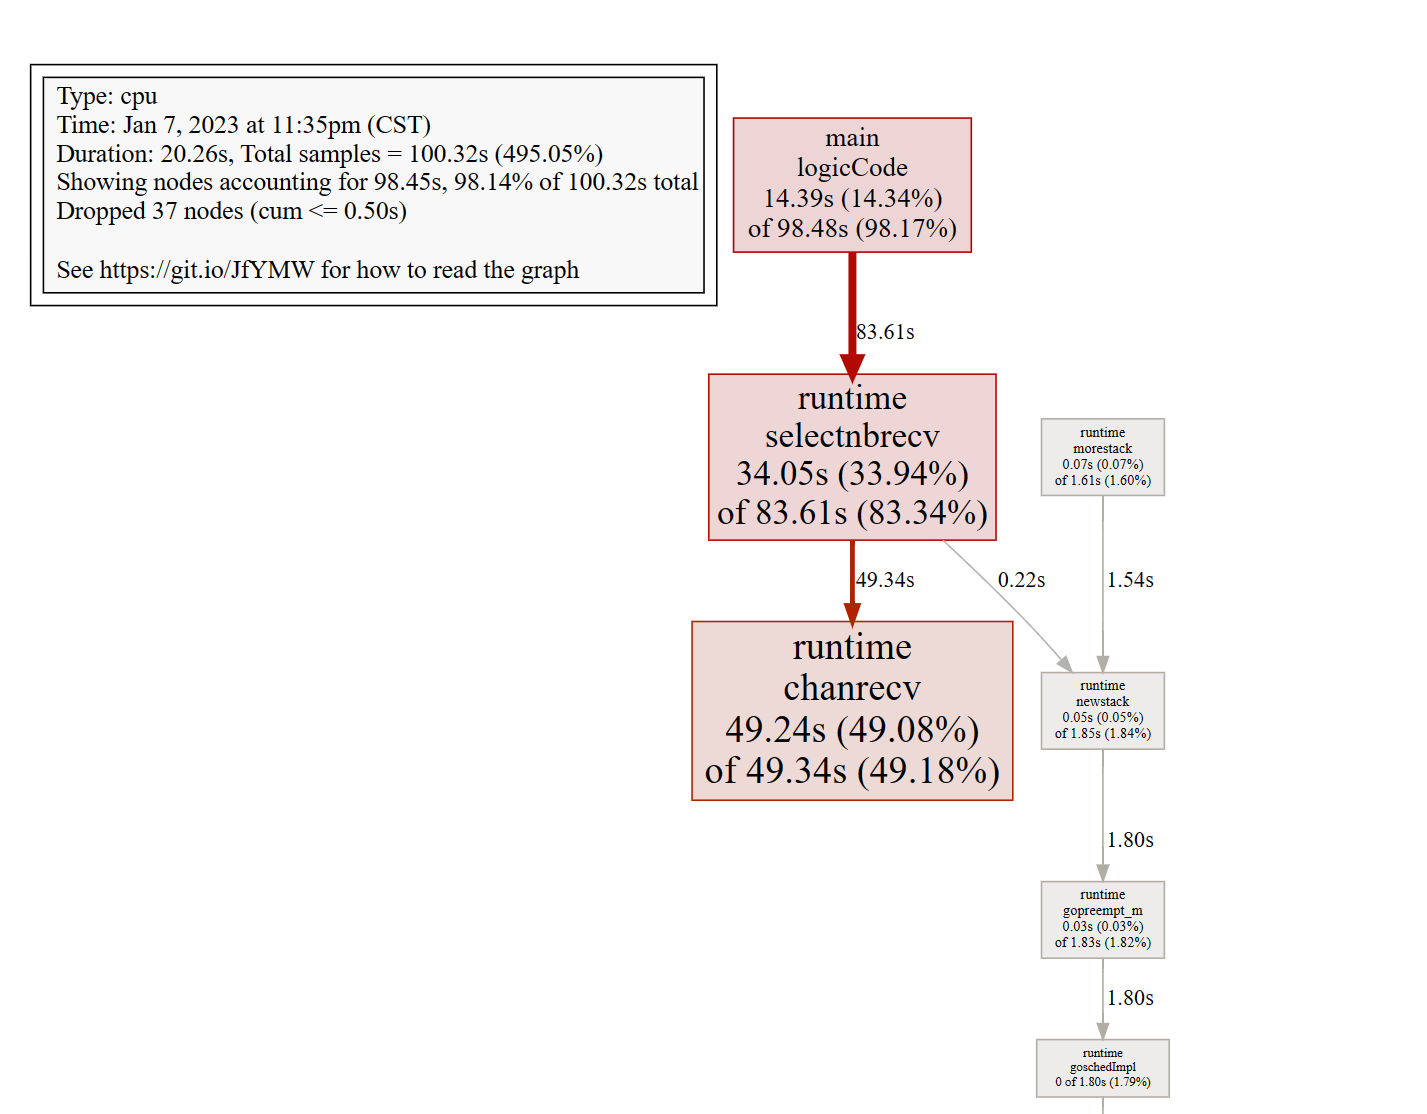
图中各个方块的大小也代表 CPU 占用的情况,方块越大说明占用 CPU 时间越长。
线条代表了函数的调用链,线条越粗,代表指向的函数消耗了越多的资源。反之亦然。
线条的样式代表了调用关系。实线代表直接调用;虚线代表中间少了几个节点;带有inline字段表示该函数被内联进了调用方。
除了这种方式,目前推荐的是pprof,也就是说pprof就已经集成了这样的功能,包括火焰图等,
地址:https://github.com/google/pprof
1
| go tool pprof -http=":8881" .\cpu.pprof
|
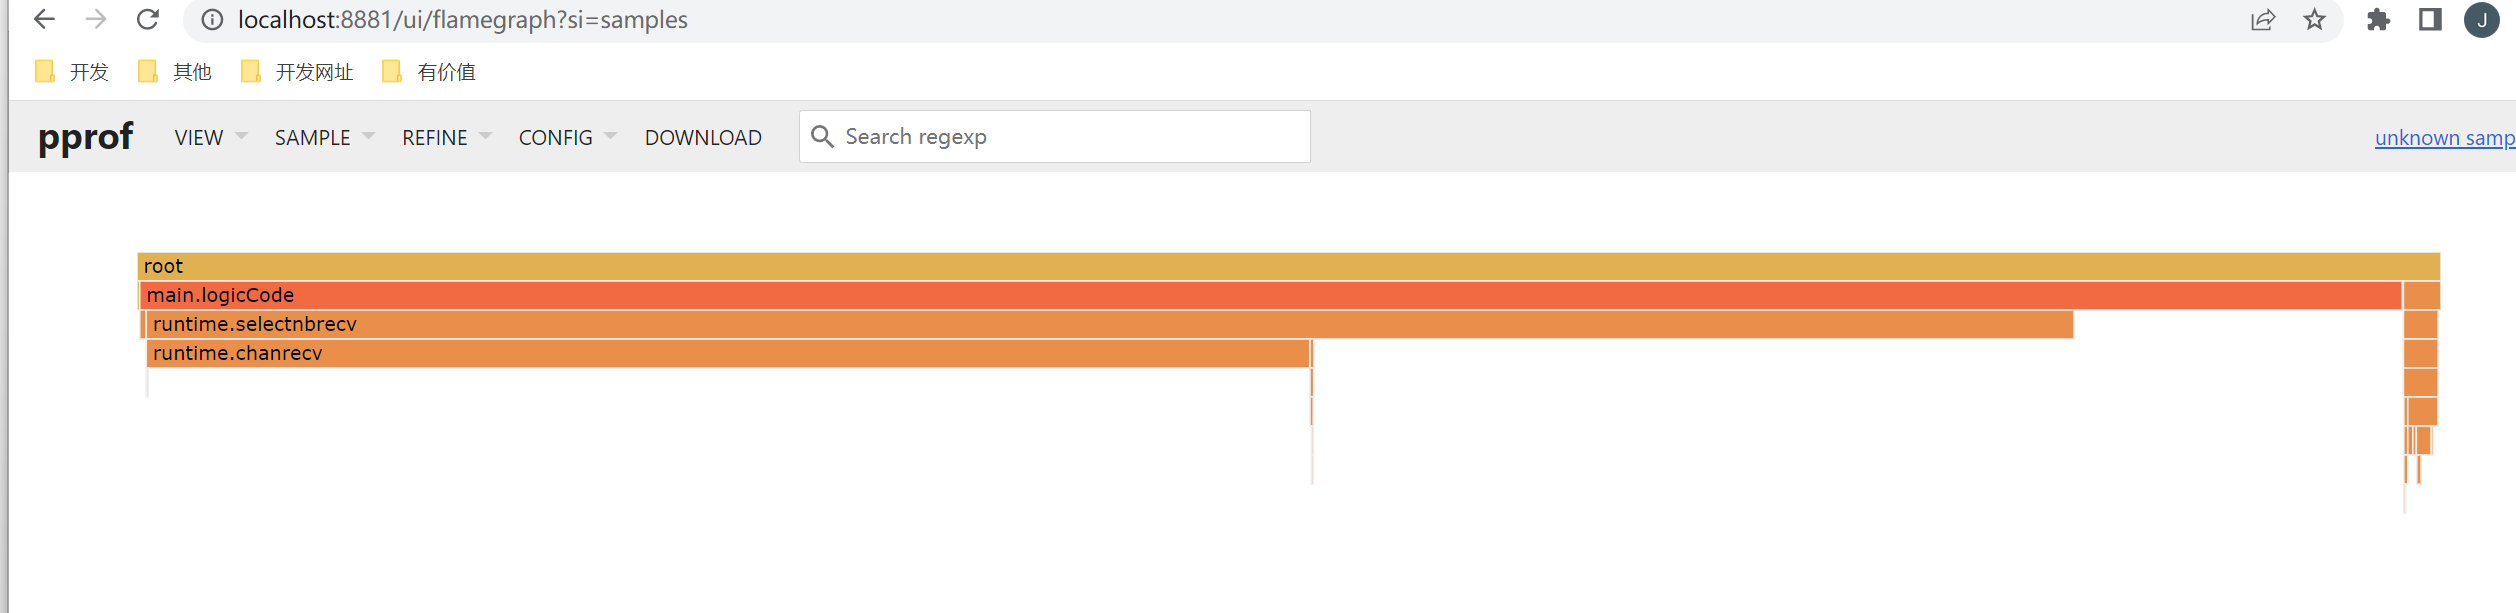
火焰图就看长短即可。每一个方块代表的是函数,长短就是执行时间,调用关系是从上到下。颜色无特殊含义。
比较
1
| go tool pprof -base .\mem1.pprof .\mem.pprof
|
假设我们已经通过命令行得到profile1与profile2,使用go tool pprof -base profile1 profile2,便可以以profile1为基础,得出profile2在profile1之上出现了哪些变化。通过两个时间切片的比较,我们可以清晰的了解到,两个时间节点之中发生的变化,方便我们定位问题
总结步骤
- 通过监控平台监测到内存或cpu问题。
- 通过浏览器方式大致判断是哪些可能的问题。
- 通过命令行方式抓取几个时间点的profile
- 使用web命令查看函数调用图
- 使用top 、traces、list 命令定位问题
- 如果出现了goroutine泄漏或者内存泄漏等随着时间持续增长的问题,go tool pprof -base比较两个不同时间点的状态更方便我们定位问题。
服务型
在Web服务中,我们使用服务型进行性能分析
注:也是基于工具型来实现的
如果使用的gin框架,则可以直接使用github.com/gin-contrib/pprof,在代码中通过以下命令注册pprof相关路由。
以gin框架为例,使用方式和上面一样,无非profile文件变成了一个http连接
1
| go tool pprof http://localhost/debug/pprof/heap
|
案例
模拟内存泄漏,一般内存泄漏大多是goroutine泄漏
 1
 2
 3
 4
 5
 6
 7
 8
 9
10
11
12
13
14
15
16
17
18
19
20
21
22
23
24
25
26
27
28
29
30
31
32
33
34
35
36
37
38
39
40
| func main() {
r := gin.Default()
r.Use(midd.RequestLog())
//路由
router.InitRouter(r)
r.StaticFS("/upload", http.Dir("upload"))
//开启pprof
pprof.Register(r)
r.GET("/mem", func(c *gin.Context) {
// 业务代码运行
outCh := make(chan int)
// 每秒起10个goroutine,goroutine会阻塞,不释放内存
tick := time.Tick(time.Second / 10)
i := 0
for range tick {
i++
fmt.Println(i)
alloc1(outCh) // 不停的有goruntine因为outCh堵塞,无法释放
}
})
srv.Run(r, config.C.SC.Name, config.C.SC.Addr, nil)
}
// 一个外层函数
func alloc1(outCh chan<- int) {
go alloc2(outCh)
}
// 一个内层函数
func alloc2(outCh chan<- int) {
func() {
defer fmt.Println("alloc-fm exit")
// 分配内存,假用一下
buf := make([]byte, 1024*1024*10)
_ = len(buf)
fmt.Println("alloc done")
outCh <- 0
}()
}
|
 1
 2
 3
 4
 5
 6
 7
 8
 9
10
11
12
13
| go tool pprof http://localhost/debug/pprof/goroutine
Type: goroutine
Time: Jan 8, 2023 at 11:22am (CST)
Entering interactive mode (type "help" for commands, "o" for options)
(pprof) top
Showing nodes accounting for 751, 99.73% of 753 total
Dropped 64 nodes (cum <= 3)
Showing top 10 nodes out of 19
flat flat% sum% cum cum%
751 99.73% 99.73% 751 99.73% runtime.gopark
0 0% 99.73% 4 0.53% io.ReadFull
0 0% 99.73% 723 96.02% main.alloc2
0 0% 99.73% 723 96.02% main.alloc2.func1
|
可以看到有751个goroutine处于挂起(runtime.gopark)状态,即goroutine泄漏。
1
2
3
4
5
6
7
8
9
| (pprof) traces
Type: goroutine
Time: Jan 8, 2023 at 11:22am (CST)
-----------+-------------------------------------------------------
723 runtime.gopark
runtime.chansend
runtime.chansend1
main.alloc2.func1
main.alloc2
|
trace命令,可以查看栈调用信息,就能很快的找到问题在于main包中alloc2方法的匿名函数出现了channel send堵塞。
 1
 2
 3
 4
 5
 6
 7
 8
 9
10
11
12
13
14
15
16
17
18
19
20
21
| (pprof) list main.alloc2
Total: 753
ROUTINE ======================== main.alloc2 in D:\go\project\test_project\project-api\main.go
0 723 (flat, cum) 96.02% of Total
. . 49: buf := make([]byte, 1024*1024*10)
. . 50: _ = len(buf)
. . 51: fmt.Println("alloc done")
. . 52:
. . 53: outCh <- 0
. 723 54: }()
. . 55:}
ROUTINE ======================== main.alloc2.func1 in D:\go\project\test_project\project-api\main.go
0 723 (flat, cum) 96.02% of Total
. . 48: // 分配内存,假用一下
. . 49: buf := make([]byte, 1024*1024*10)
. . 50: _ = len(buf)
. . 51: fmt.Println("alloc done")
. . 52:
. 723 53: outCh <- 0
. . 54: }()
. . 55:}
|
最终定位是outCh <- 0发生了问题,当然原因是channel只发,未取 造成了阻塞